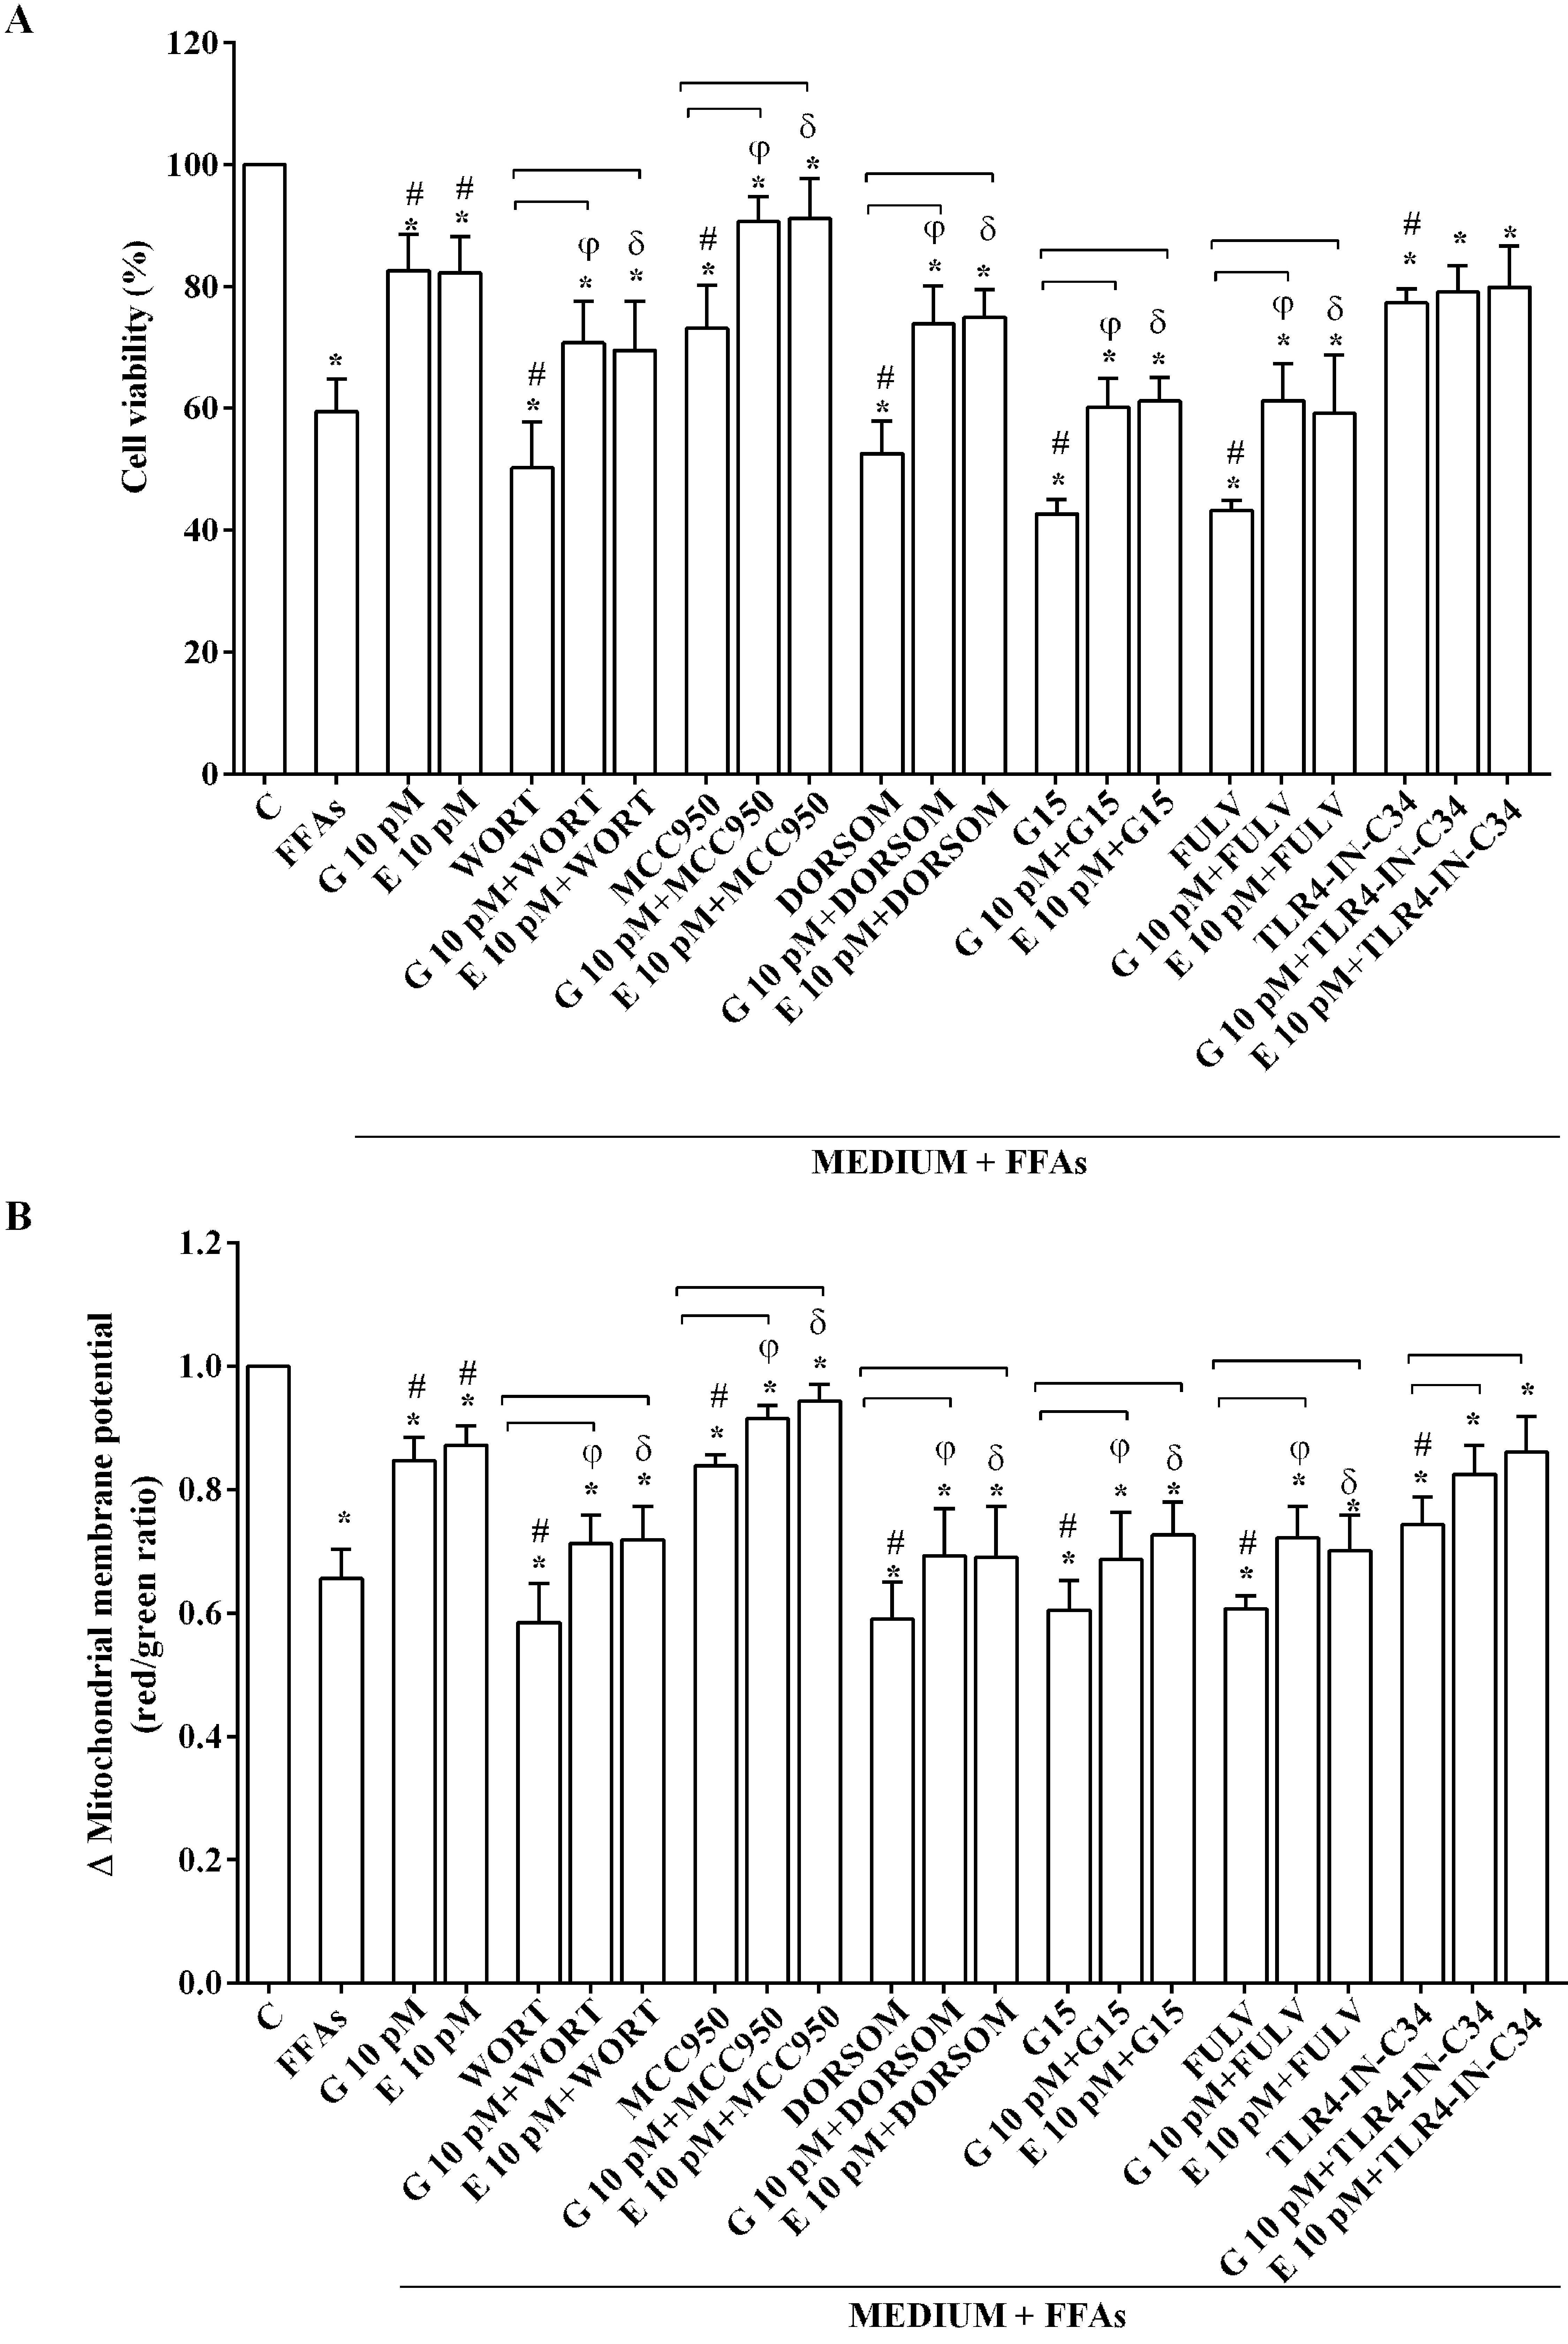
Fig. 6. Effects of genistein and 17β-estradiol on cell viability (A) and mitochondrial membrane potential (B) in Huh7.5 cells in presence/absence of inhibitors. G: genistein; E: 17β-estradiol. C=control (untreated cells); FFAs=free fatty acids. WORT (1 nM wortmannin for 30 min); MCC950 (NLRP3 inhibitor; 1 nM for 30 min); DORSOM (1 nM dorsomorphin for 30 min); G15 (1 nM for 30 min); FULV (fulvestrant; 1 nM for 30 min); TLR4-IN-C34 (TLR4 inhibitor; 1 nM for 30 min). Reported data are means ± SD of five independent experiments for each experimental protocol. Significance between groups: * P <0.05 vs C; # P <0.05 vs FFAs; φ P <0.05 vs G 10 pM; δ P <0.05 vs. E 10 pM. Short square brackets indicate significance among groups (P <0.05).